Blogs
|
PC sales are imploding
http://www.businessinsider.com/pc-sales-plummet-in-q2-2015-gartner-idc-say-2015-7
"PC sales are continuing to crash: New data from two research firms shows that the industry is declining fast, with a drop in sales year-on-year of about 10%.
On Wednesday, both Gartner and IDC published estimates for PC shipments in the second quarter of 2015 — and it makes for unpleasant reading for hardware vendors.
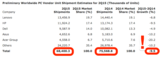
Gartner says sales have dropped by 9.5% over the past year, while IDC’s data is even more alarming — predicting a year-on-year decline of 11.8%.
The Wall Street Journal (where we first saw the data) points out this disparity is due to the fact that Gartner includes "ultramobile premium devices" (aka certain tablet devices) in its figures, while IDC does not.
Gartner estimates negative growth for every major PC hardware vendor: Lenovo, the market leader, dropped by 6.8%, while Acer Group saw the biggest fall — a 20.2% decline. Overall, shipments dropped to 68.4 million, down from 75.6 million a year before.
Gartner
Meanwhile, IDC’s data shows a more aggressive decline. Apple, which is not included in Gartner’s global data, is the only company to see any increase year-on-year. IDC’s figures paint an even bleaker picture for Acer Group: a 26.9% decline. They put Q2 2015 shipments at 66.1 million, down from 75 million in 2014.
IDC
This shouldn’t necessarily be interpreted as a coup for Apple, however. Gartner does include Apple in its figures for shipments within the US, its home market — and there the Cupertino company is facing a 2.5% decline.
Gartner
Lenovo has attempted to put a brave face on the news. In a statement, president and COO Gianfranco Lanci says the data shows "continued growth of our market share in our core PC business, which is a strong, powerful growth engine for the company." He says the company has "ample opportunity for continued growth" in the sector — despite the fact that while its percentage market share is increasing, its real-term shipment numbers are dropping.
This, as The Wall Street Journal points out, is the biggest drop in almost two years (2.6% in 2012, 11.1% in 2013, 0.8% in 2014). Gartner identifies three factors as contributing to this latest decline:
"A sharp appreciation of the US dollar against local currencies" is one, according to principal analyst Mikako Kitagawa — making PCs more expensive.
"The worldwide PC market experienced unusually positive desk-based growth last year due to the end of Windows XP support. After the XP impact was phased out, there have not been any major growth drivers to stimulate a PC refresh."
The coming launch of Windows 10. Kitagawa says: "The Windows 10 launch scheduled for 3Q15 has created self-regulated inventory control. PC vendors and the channels tried clearing inventory as much as possible before the Windows 10 launch." In short, people aren’t buying PCs as they wait for the latest OS from Microsoft — further denting sales.
Overall, Gartner is forecasting a decline of 4.4% in PC shipments throughout 2015. The research firm expects the industry to return to "slow and steady growth in 2016." But the data is clear: The age of the PC is over."
Read more: http://www.businessinsider.com/pc-sales-plummet-in-q2-2015-gartner-idc-say-2015-7#ixzz3fbadjM2j
WSJ:
PC Sales Continue to Fall
http://blogs.wsj.com/digits/2015/07/09/pc-sales-continue-to-fall/
Stephen
Stephen Abram
.
Blog
.
<span class='date ' tip=''><i class='icon-time'></i> Aug 05, 2015 04:37am</span>
|
|
Instagram is now the go-to social network for US teens
Read more: http://www.businessinsider.com/instagram-is-now-go-to-social-network-for-us-teens-2015-6#ixzz3eUfado7B
"Instagram is steadily taking the place of Facebook and Twitter among teens and young millennials.
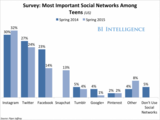
In the last twice-yearly Piper Jaffray survey of US teens, 32% of respondents named Instagram as the most important social network, while only 24% said Twitter was most important, and only 14% pointed to Facebook.
Here are a few of the key takeaways from the BI Intelligence report:
Pinterest has tremendous reach among women. Among US female internet users, 42% reported being on Pinterest in Pew’s late-2014 survey, compared to only 13% of men.
Instagram has become the most important and most-used social network for US teens. 32% of US teenagers cited it as their most important social network in Piper Jaffray’s twice-annual teen survey, compared to only 14% saying that of Facebook.
Snapchat, Vine, and Tumblr had by far the most youthful user bases of the social networks we looked at. 45% of Snapchat’s adult users are between 18 and 24, followed by Vine (28%) and Tumblr (28%), according to comScore.
LinkedIn enjoys high adoption among highly educated and high-income users. LinkedIn is used by 44% of Americans with income of $75,000 or more, according to Pew.
Messaging apps also have become more broadly popular, but still skew young: 7% of all people in the US aged 12 and older use WhatsApp, according to the Edison Research and Triton Digital survey.
The aging of Facebook, Twitter, LinkedIn, and even Pinterest is more apparent than ever. That’s especially true of Facebook: Less than two-fifths of Facebook’s adult user base in the US is aged 18 to 34, according to comScore."
Read more: http://www.businessinsider.com/instagram-is-now-go-to-social-network-for-us-teens-2015-6#ixzz3eUfqBpXb
Stephen
Stephen Abram
.
Blog
.
<span class='date ' tip=''><i class='icon-time'></i> Aug 05, 2015 04:37am</span>
|
|
New Data: Millennials Outnumber Baby Boomers in U.S. According to New Census Bureau Estimates
Via Gary Price at LJ InfoDOCKET
http://www.infodocket.com/2015/06/29/data-millennials-outnumber-baby-boomers-in-u-s-according-to-new-census-bureau-estimates/
"From the U.S. Census:
Millennials, or America’s youth born between 1982 and 2000, now number 83.1 million and represent more than one quarter of the nation’s population. Their size exceeds that of the 75.4 million baby boomers, according to new U.S. Census Bureau estimates released today. Overall, millennials are more diverse than the generations that preceded them, with 44.2 percent being part of a minority race or ethnic group (that is, a group other than non-Hispanic, single-race white).
These latest population estimates examine changes among groups by age, sex, race and Hispanic origin nationally, as well as in all states and counties, between April 1, 2010, and July 1, 2014.
Even more diverse than millennials are the youngest Americans: those younger than 5 years old. In 2014, this group became majority-minority for the first time, with 50.2 percent being part of a minority race or ethnic group.
Reflecting these younger age groups, the population as a whole has become more racially and ethnically diverse in just the last decade, with the percentage minority climbing from 32.9 percent in 2004 to 37.9 percent in 2014.
Five states or equivalents were majority-minority: Hawaii (77.0 percent), the District of Columbia (64.2 percent), California (61.5 percent), New Mexico (61.1 percent) and Texas (56.5 percent). Among the remaining states, Nevada is the closest to crossing this threshold, with a population 48.5 percent minority. More than 11 percent (364) of the nation’s 3,142 counties were majority-minority in 2014. Five reached this milestone during the year beginning July 1, 2013: Russell, Ala.; Newton, Ga.; Eddy, N.M.; Brazoria, Texas; and Suffolk city, Va.
Other highlights from the estimates:
The 65-and-older population
The nation’s 65-and-older population grew from 44.7 million in 2013 to 46.2 million in 2014. This group, which now contains the oldest four years of the baby boom generation (born between 1946 and 1964), is 21.7 percent minority, less diverse than younger age groups.
Between 2010 and 2014, the only two counties to add more than 100,000 people 65 and older to their total populations were Los Angeles, Calif. (167,000) and Maricopa, Ariz.(103,000).
San Juan, Colo., had the highest rate of increase in the 65-and-older population of any county between 2010 and 2014 (70.9 percent). Two other Colorado counties (San Migueland Douglas) were also in the top five.
Florida had the highest percentage of its population age 65 and older among states in 2014 (19.1 percent), followed by Maine (18.3 percent). Alaska had the lowest percentage (9.4 percent), followed by Utah (10.0 percent).
Sumter, Fla., was the nation’s only majority 65-and-older population county in 2014 (52.9 percent). Chattahoochee, Ga., had the lowest percentage of its population in this age group (4.1 percent).
Some states and counties become younger
In contrast to most states, five experienced a decline in median age between July 1, 2013, and July 1, 2014: North Dakota, Hawaii, Montana, Wyoming and Iowa.
Median age declined in 434 counties over the period, with McKenzie, N.D., leading the way (32.9 to 31.6).
Maine experienced the largest increase in median age among states, rising from 43.9 to 44.2 over the period.
St. Helena, La., experienced the largest rise in median age among counties or equivalents, climbing from 40.2 to 41.3.
There was a greater than 13-year difference between the state with the highest median age (Maine at 44.2) and that with the lowest (Utah at 30.5).
There was a more than 42-year difference between the county with the highest median age (Sumter, Fla., at 65.9) and that with the youngest (Madison, Idaho, at 23.1). There were 74 counties where the median age was greater than 50, and 57 counties where it was less than 30.
States with more males than females (and vice versa)
There were only 10 states where males made up a majority of the population in 2014.Alaska had the highest male percentage (52.6 percent), followed by North Dakota (51.3 percent).
The District of Columbia had the highest percentage of females of any state or equivalent (52.6 percent), followed by Delaware (51.6 percent).
Births versus deaths
All race and ethnic groups except single-race, non-Hispanic whites had more births than deaths between 2013 and 2014. This group had 61,841 more deaths than births.
Hispanics
The nation’s Hispanic population totaled 55.4 million as of July 1, 2014, up by 1.2 million, or 2.1 percent, since July 1, 2013.
California had the largest Hispanic population of any state in 2014 (15.0 million). However, Texas had the largest numeric increase within the Hispanic population since July 1, 2013 (228,000). New Mexico had the highest percentage of Hispanics at 47.7 percent.
Los Angeles had the largest Hispanic population of any county (4.9 million) in 2014 whileHarris, Texas, had the largest numeric increase since 2013 (45,000). Starr — on the Mexican border in Texas — had the highest share of Hispanics (95.8 percent).
Blacks
The nation’s black or African-American population totaled 45.7 million as of July 1, 2014, up by 578,000, or 1.3 percent, since July 1, 2013.
New York had the largest black or African-American population of any state or equivalent in 2014 (3.8 million); Texas had the largest numeric increase since July 1, 2013 (88,000). The District of Columbia had the highest percentage of blacks (50.6 percent), followed by Mississippi (38.2 percent).
Cook County, Ill. (Chicago) had the largest black or African-American population of any county in 2014 (1.3 million), and Harris, Texas, had the largest numeric increase since 2013 (21,000). Holmes, Miss., was the county with the highest percentage of blacks or African-Americans in the nation (82.5 percent).
Asians
The nation’s Asian population totaled 20.3 million as of July 1, 2014, up by 631,000, or 3.2 percent, since July 1, 2013.
California had both the largest Asian population of any state (6.3 million) in July 2014 and the largest numeric increase of Asians since July 1, 2013 (162,000). Hawaii was the nation’s only majority-Asian state, with people of this group comprising 56.2 percent of the total population.
Los Angeles had the largest Asian population of any county (1.7 million) in 2014 and the largest numeric increase (29,000) since 2013. Honolulu and Kauai, both in Hawaii, were the nation’s only majority-Asian counties.
American Indians and Alaska Natives
The nation’s American Indian and Alaska Native population totaled 6.5 million as of July 1, 2014, up by 93,000, or 1.4 percent, since July 1, 2013.
California had the largest American Indian and Alaska Native population of any state in 2014 (1.1 million) and the largest numeric increase since 2013 (13,000). Alaska had the highest percentage (19.4 percent).
Los Angeles had the largest American Indian and Alaska Native population of any county in 2014 (235,000), and Maricopa, Ariz., the largest numeric increase (4,700) since 2013. Shannon, S.D. — on the Nebraska border and located entirely within the Pine Ridge Indian Reservation — had the highest percentage (93.4 percent).
Native Hawaiians and Other Pacific Islanders
The nation’s Native Hawaiian and Other Pacific Islander population totaled 1.5 million as of July 1, 2014, up by 33,000, or 2.3 percent, since July 1, 2013.
Hawaii had the largest population of Native Hawaiians and Other Pacific Islanders of any state (370,000) in 2014 and the highest percentage (26.0 percent). California had the largest numeric increase since 2013 (7,000).
Honolulu had the largest population of Native Hawaiians and Other Pacific Islanders of any county (239,000) in 2014, and Hawaii County had the highest percentage (34.4 percent). Clark, Nev., had the largest numeric increase since 2013 (1,100).
Non-Hispanic white alone
The nation’s non-Hispanic white alone population totaled 197.9 million in 2014, up by 94,000, or 0.5 percent, since 2013.
California had the largest non-Hispanic white alone population of any state in 2014 (14.9 million). Texas had the largest numeric increase in this population group since 2013 (79,000). Maine had the highest percentage of the non-Hispanic white alone population (93.8 percent).
Los Angeles had the largest non-Hispanic white alone population of any county (2.7 million) in 2014. Maricopa, Ariz., had the largest numeric increase in this population since 2013 (23,000). Leslie, Ky., comprised the highest percentage (98.1 percent) of single-race non-Hispanic whites.
Direct to Downloadable Data Tables
Direct to Population Estimates by Demographic Characteristic: July 1, 2014
Tables and downloadable data files containing population estimates by age, sex, race, and Hispanic origin for the U.S., states, counties, and Puerto Rico are now available. Annual and monthly estimates are given for the period April 1, 2010 to July 1, 2014. (via American Factfinder)
Stephen Abram
.
Blog
.
<span class='date ' tip=''><i class='icon-time'></i> Aug 05, 2015 04:37am</span>
|
|
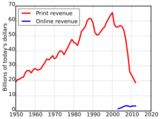
Mid-year report: The newspaper industry’s billion dollar challenge
http://www.poynter.org/news/mediawire/353911/mid-year-report-the-newspaper-industrys-billion-dollar-challenge/#.VaPF5Lvd-Ys.twitter
Stephen
Stephen Abram
.
Blog
.
<span class='date ' tip=''><i class='icon-time'></i> Aug 05, 2015 04:37am</span>
|
|
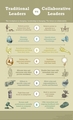
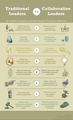
Traditional Leaders versus Collaborative Leaders
http://www.collaborativelead.com/
Stephen
Stephen Abram
.
Blog
.
<span class='date ' tip=''><i class='icon-time'></i> Aug 05, 2015 04:36am</span>
|
|
HBR Blog: Navigating the Dozens of Different Strategy Options
https://hbr.org/2015/06/navigating-the-dozens-of-different-strategy-options
"In this adaptation from the new book, Your Strategy Needs a Strategy (HBR Press, 2015), BCG strategy experts make sense of the all the different, and competing, approaches to strategy: Which strategy is right for your business? When and how should you implement it? The practical tool offered here helps executives answer such questions as: What replaces planning when the annual cycle is obsolete? Where can we — and when should we — shape the game to our advantage? How do we simultaneously implement different strategies across different business units?"
https://hbr.org/resources/images/article_assets/2015/06/W150616_REEVES_5APPROACHES-.png
Stephen
Stephen Abram
.
Blog
.
<span class='date ' tip=''><i class='icon-time'></i> Aug 05, 2015 04:36am</span>
|
|
Here’s who really has the power at Reddit
Read more: http://www.businessinsider.com/reddit-subreddit-growth-7x-since-2012-2015-7#ixzz3fJwPVoUV
Stephen
Stephen Abram
.
Blog
.
<span class='date ' tip=''><i class='icon-time'></i> Aug 05, 2015 04:36am</span>
|
|
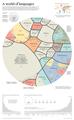
The World’s Most Spoken Languages And Where They Are Spoken
http://www.iflscience.com/environment/worlds-most-spoken-languages-and-where-they-are-spoken
Stephen
Stephen Abram
.
Blog
.
<span class='date ' tip=''><i class='icon-time'></i> Aug 05, 2015 04:36am</span>
|
|
Traditional Leaders vs Collaborative Leaders
http://www.collaborativelead.com/
Stephen
Stephen Abram
.
Blog
.
<span class='date ' tip=''><i class='icon-time'></i> Aug 05, 2015 04:36am</span>
|
|
How Much Of The World Population Is Online - Statistics And Trends
http://www.invesp.com/blog/world-population-online/
Stephen
Stephen Abram
.
Blog
.
<span class='date ' tip=''><i class='icon-time'></i> Aug 05, 2015 04:35am</span>
|