Blogs
|
What Education Technology Could Look Like Over the Next Five Years
http://ww2.kqed.org/mindshift/2015/06/29/what-education-technology-could-look-like-over-the-next-five-years/
TRENDS & ISSUES
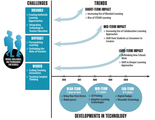
Deeper Learning
Rethinking Traditions:
How Integrating Arts Into Other Subjects Makes Learning Come Alive
To Advance Education, We Must First Reimagine Society
Unexpected Tools That are Influencing the Future of Education
Collaborations
Blended Learning
CHALLENGES
Authentic Learning
Professional Development
Personalized Learning & Teacher’s Role
Scalability
DEVELOPMENTS IN ED TECH
BYOD/Maker Movement
3-D Printing
Adaptive Learning
Badges and Wearables
Stephen
Stephen Abram
.
Blog
.
<span class='date ' tip=''><i class='icon-time'></i> Aug 05, 2015 04:39am</span>
|
|
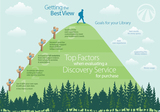
Discovery bewerten: Testen Sie mit Ihren eigenen Daten (text in German)
https://discovery.ebsco.com/pulse/article/discovery-evaluieren-test-mit-ihren-eigenen-daten#When:09:53:00Z
Stephen
Stephen Abram
.
Blog
.
<span class='date ' tip=''><i class='icon-time'></i> Aug 05, 2015 04:39am</span>
|
|
Top Four Reasons Students Use Their College Library
http://blog.cengage.com/top-four-reasons-students-use-their-college-library/
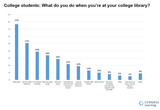
"Why Go to the College Library? Students’ Top Four Responses
1. Study alone. By far the most popular response at 77%, the clear majority of our surveyed students head to the library to focus on their studies… by themselves. To us, this response shows that, no matter what kinds of resources are offered by the library, this learning space is (and will probably always be) regarded as a great place to get serious about schoolwork.
It also means that, during peak study periods (such as finals week), students would do well to get to the library early to secure the study spot of their choice!
2. Use the online databases. More than half (51%) of the students said that they’re at the library to use the online databases, indicating that a good portion of their research work is completed at the library.
Unfortunately, many students will often find themselves in front of a looming deadline… and a closed library. Or perhaps they can’t make it to the campus library for other reasons (such as parenting responsibilities, a lack of transportation options, or a need to travel away from home). Lessen your students’ stress by reminding them that they can access their college’s databases from their own computer. Typically, all they’ll need is internet access and a username and password (which usually requires a campus e-mail account or college library card). (Of course, before mentioning this, you’ll want to double-check to ensure that this is true for your school.)
Starting your students on a research and writing project? Encourage them to review these nine tips for successfully writing a research paper.
3. Use reference materials. Whether they’re in need of general resources such as encyclopedias, and dictionaries, specialized publications such as field-specific bibliographical guides and indexes, or other references that simply aren’t available in electronic formats, students visit the library to access non-circulating materials that they need to complete their projects.
Even so, given that only 39% of students stating that they use the reference materials, we recognize that many students may not even be aware of these materials’ existence. (Or, if they do, they may not know the valuable role they can play in the research process.) If your course includes a research project, encourage your students to make use of them. Students may also appreciate being reminded that, if they aren’t sure how to use these helpful reference tools, their campus librarian will be able to assist them.
To further guide your students, you may even wish to make a bibliography that lists the reference materials that would be of most use to them. But first, you might want to check your library’s website; in many cases, the librarians have already created subject guides that describe the resources available for specific fields and disciplines. Your librarian may also be able to create a course guide that lists the reference materials (and other resources) that suit the specific needs of your class.
4. Meet their study groups. Whether it’s for the luxury of having a big table, the convenience of accessing nearby scholarly and reference materials, or the simplicity of having a central place to meet that’snot their own homes, the library is a popular place for students to gather for study and group projects. More than one third (34%) of students said that’s why they visit their library.
Are you assigning group projects for your course, or do you recommend that students get together in groups to study? If you know students will use the library as a meeting space, advise them to reserve a study room. There, they can talk over the details of their projects without worrying that their conversation is disturbing other students.
How Else do College Students Use the Library?
Of course, the college library offers many benefits beyond the four explored above. Review the complete set of responses to discover more about students’ library habits. Then, consider how you might prompt your students to make full use of the valuable services and resources offered at your school’s library.
Even if your course is fully online, your students can still find ways to use the library’s services, whether by accessing databases from home, requesting books through interlibrary loan, chatting with an online librarian, or using the library’s website to discover videos, tutorials, and other tutorials that will help them conduct their research efficiently and effectively.
Full responses:
Study alone
77%
Use the online databases
51%
Use reference materials
39%
Meet my study group
34%
Check out books
29%
Use books my instructor has placed on reserve
22%
Look up job/career resources
19%
Socialize with friends
13%
Attend events
10%
Read non-circulating materials (e.g., magazines and journals)
8%
Sleep
6%
Take classes on how to use the library’s resources
5%
Other
9%"
Stephen
Stephen Abram
.
Blog
.
<span class='date ' tip=''><i class='icon-time'></i> Aug 05, 2015 04:38am</span>
|
|
How Do Americans Spend Their Time? 2014 American Time Use Survey Released
Via Gary Price at LJ infoDocket
http://www.infodocket.com/2015/07/02/new-datadata-files-how-do-americans-spend-their-time-2014-american-time-use-survey-released/
"The data tables noted in the highlights below can be accessed here.
Additional data files including data from previous American Time Survey’s q3
From the Bureau of Labor Statistics:
In 2014, on days they worked, 23 percent of employed persons did some or all of their work at home, and 85 percent did some or all of their work at their workplace, the U.S. Bureau of Labor Statistics reported today. In 2003, the first year for which comparable data are available, 19 percent of employed persons did some or all of their work at home, and 87 percent did some or all their work at their workplace on days worked.
These and other results from the American Time Use Survey (ATUS) were [recently released].
These data include the average amount of time per day in 2014 that individuals worked, did household activities, and engaged in leisure and sports activities. Additionally, measures of the average time per day spent providing childcare—both as a primary (or main) activity and while doing other things—for the combined years 2010-2014 are provided. For a further description of ATUS data and
methodology, see the Technical Note.
Highlights
Working (by Employed Persons) in 2014
Employed persons worked an average of 7.8 hours on the days they worked. More hours were worked, on average, on weekdays than on weekend days—8.1 hours compared with 5.7 hours. (See table 4.)
Many more people worked on weekdays than on weekend days: 83 percent of employed persons worked on an average weekday, compared with 35 percent on an average weekend day. (See table 4.)
On the days they worked, employed men worked 52 minutes more than employed women. This difference partly reflects women’s greater likelihood of working part time. However, even among full-time workers (those usually working 35 hours or more per week), men worked longer than women—8.4 hours compared with 7.8 hours. (See table 4.)
On the days they worked, 85 percent of employed persons did some or all of their work at their workplace and 23 percent did some or all of their work at home. Employed persons spent more time working at the workplace than at home—8.0 hours compared with 3.2 hours. (See table 6.)
From 2003 to 2014, the share of employed persons who did some or all of their work at home on days they worked increased from 19 percent to 23 percent. During this same period, the average time employed persons spent working at home on days they did so increased by 37 minutes (from 2.6 hours to 3.2 hours). (See table 6.)
Multiple jobholders were more likely to work on an average day than were single jobholders— 81 percent compared with 68 percent. (For a definition of average day, see the Technical Note.) Multiple jobholders also were more likely to work at home than were single jobholders—37 percent compared with 22 percent. (See table 6.)
Self-employed workers were nearly three times more likely than wage and salary workers to have done some work at home on days worked—58 percent compared with 20 percent. Self- employed workers also were more likely to work on weekend days than were wage and salary workers—46 percent compared with 33 percent. (See tables 5 and 7.)
On the days they worked, 39 percent of employed people age 25 and over with a bachelor’s degree or higher did some work at home, compared with only 12 percent of those with less than a high school diploma. (See table 6.)
Household Activities in 2014
On an average day, 83 percent of women and 65 percent of men spent some time doing household activities such as housework, cooking, lawn care, or financial and other household management. (See table 1.)
On the days they did household activities, women spent an average of 2.6 hours on such activities, while men spent 2.1 hours. (See table 1.)
On an average day, 20 percent of men did housework—such as cleaning or laundry—compared with 49 percent of women. Forty-three percent of men did food preparation or cleanup, compared with 69 percent of women. Men were slightly more likely to engage in lawn and garden care than were women—11 percent compared with 8 percent. (See table 1.)
From 2003 to 2014, the share of men doing food preparation and cleanup on an average day increased from 35 percent to 43 percent. Over this same period, the share of women doing housework on an average day decreased from 54 percent to 49 percent. The average time per day women spent doing housework declined by 9 minutes, from 58 minutes in 2003 to 49 minutes in 2014. (See table 1.)
Leisure Activities in 2014
On an average day, nearly everyone age 15 and over (96 percent) engaged in some sort of leisure activity such as watching TV, socializing, or exercising. Of those who engaged in leisure activities, men spent more time in these activities (6.0 hours) than did women (5.2 hours). (See table 1.)
Watching TV was the leisure activity that occupied the most time (2.8 hours per day), accounting for more than half of leisure time, on average, for those age 15 and over. Socializing, such as visiting with friends or attending or hosting social events, was the next most common leisure activity, accounting for 43 minutes per day. (See table 1.)
Men were more likely than women to participate in sports, exercise, or recreation on a given day—22 percent compared with 17 percent. On days they participated, men also spent more time in these activities than did women—1.8 hours compared with 1.3 hours. (See table 1.)
On an average day, adults age 75 and over spent 8.0 hours engaged in leisure activities—more than any other age group; 35- to 44-year-olds spent 4.1 hours engaged in leisure and sports activities—less than other age groups. (See table 11.)
Time spent reading for personal interest and playing games or using a computer for leisure varied greatly by age. Individuals age 75 and over averaged 1.0 hour of reading per weekend day and 24 minutes playing games or using a computer for leisure. Conversely, individuals ages 15 to 19 read for an average of 8 minutes per weekend day and spent 1.2 hours playing games or using a computer for leisure. (See table 11.)
Employed adults living in households with no children under age 18 engaged in leisure activities for 4.6 hours per day, almost an hour more than employed adults living with a child under age 6. (See table 8B.)
Care Of Household Children for the Period 2010-2014
Adults living in households with children under age 6 spent an average of 2.0 hours per day providing primary childcare to household children. Adults living in households where the youngest child was between the ages of 6 and 17 spent less than half as much time providing primary childcare to household children—49 minutes per day. Primary childcare is childcare that is done as a main activity, such as providing physical care or reading to children. (See table 9.)
On an average day, among adults living in households with children under age 6, women spent 1.0 hour providing physical care (such as bathing or feeding a child) to household children; by contrast, men spent 23 minutes providing physical care. (See table 9.)
Adults living in households with at least one child under age 6 spent an average of 5.4 hours per day providing secondary childcare—that is, they had at least one child in their care while doing activities other than primary childcare. Secondary childcare provided by adults living in households with children under age 6 was most commonly provided while doing leisure activities (2.1 hours) or household activities (1.3 hours). (See table 10.)
Adults living in households with children under age 6 spent more time providing primary childcare on an average weekday (2.1 hours) than on an average weekend day (1.8 hours). However, they spent less time providing secondary childcare on weekdays than on weekend days—4.5 hours compared with 7.4 hours. (See tables 10.)
Resources
Direct to Data Tables
Direct to Data Files"
Stephen
Stephen Abram
.
Blog
.
<span class='date ' tip=''><i class='icon-time'></i> Aug 05, 2015 04:38am</span>
|
|
New Data: "Trends in High School Dropout and Completion Rates in the United States: 1972-2012″
http://www.infodocket.com/2015/06/30/new-data-trends-in-high-school-dropout-and-completion-rates-in-the-united-states-1972-2012/
Via Gary Price at LJ InfoDocket
From the National Center for Education Statistics:
This report updates a series of NCES reports on high school dropout and completion rates that began in 1988. The report draws on an array of nationally representative surveys and administrative datasets to present statistics on high school dropout and completion rates. The report includes national estimates of the percentage of students who drop out in a given 12-month period (event dropout rates), the percentage of young people in a specified age range who are high school dropouts (status dropout rates), and the percentage of young people in a specified age range who hold high school credentials (status completion rates). In addition, the report includes state-level data on event dropout rates and the percentage of students who graduate within four years of starting ninth grade (adjusted cohort graduation rates). Data are presented by a number of characteristics including race/ethnicity, sex, and socioeconomic status.
From the Report:
The national event dropout rate presented here is based on data from the CPS and is an estimate of the percentage of both private and public high school students who left high school between the beginning of one school year and the beginning of the next without earning a high school diploma or an alternative credential, such as a GED. Specifically, the rate describes the percentage of youth ages 15 through 24 in the United States who dropped out of grades 10-12 from either public or private schools in the 12 months between one October and the next (e.g., October 2011 to October 2012).11 The measure provides information about the rate at which U.S. high school students are leaving school without receiving a high school credential. As such, it can be used to study student experiences in the U.S. secondary school system in a given year. It is not well suited for studying how many people in the country lack a high school credential irrespective of whether they attended U.S. high schools, nor does it provide a picture of the dropout problem more generally because it only measures how many students dropped out in a single year, and students may reenter the school system after that time. More detail about the definition and computation of the event dropout rate and other rates along with a summary table of how rates in this report relate to each other can be found in appendix A.
Direct to Full Text Report (112 pages; PDF)"
Stephen
Stephen Abram
.
Blog
.
<span class='date ' tip=''><i class='icon-time'></i> Aug 05, 2015 04:38am</span>
|
|
I found these stats in the July/August issue of the Globe Investor supplement to Report on Business magazine to be interesting.
Number of Millennials in US: 80 million
Number of Millennials in Canada: 7 million
Based on US population surveys, Millennials emerged as the largest generation in the US labour force at the start of 2015 - for the first time.
Millennials: 54 million
GenX’ers: 53 million
Boomers: 45 million
68% of Canadians held a post secondary degree or diploma in 2011 (compare at 43% in 1981).
80% of Millennials sleep with their phones next to their beds. (Makes sense to me since most of them are cord -cutters)
Millennials are responsible for 80% of births.
Sometime library strategic planners forget to look at the impact of demographic changes.
Millennials are a huge part of what you are trying to do in:
1. supporting the economy, job finding and workforce learning - more than two thirds of the workforce are not Boomers (except probably in library land employment).
2. Children’s programming (toddlers don’t drive themselves to the library!) since Millennials are the parental population we need to reconnect with after their higher ed period.
3. Mobile devices rule. Duh. And a mobile phone is misnamed if you think it’s just a phone - it’s an internet device, tool, digital communications, and your alarm clock and calendar so you keep it by the bed at night (and who wants to run for the phone when your alarm rings in another room?!)
BTW - Millennials (GenY) are mostly finished with their formal full-time schooling now - and although we haven’t really named them yet - the folks we see in high school and as undergrads are post-Millennials (GenZ? What’ll we do when we run out of letters?) and different again.
Stephen
Stephen Abram
.
Blog
.
<span class='date ' tip=''><i class='icon-time'></i> Aug 05, 2015 04:38am</span>
|
|
Why Snapchat is ‘The Best Mobile Video Platform’
Read more: http://www.businessinsider.com/why-snapchat-is-the-best-mobile-video-platform-2015-6#ixzz3eUdrRTQE
"Snapchat, the US-based ephemeral mobile messaging app, recently made brand-friendly updates to its product that enables advertisers to reach its large mobile millennial base. Although most information regarding mobile ad performance on Snapchat has previously been conjecture, recently released stats from the company have shed some light on how brands are faring on Snapchat.
There are more than 2 billion video views on Snapchat each day.
The mobile and first-person nature of Snapchat is proving appealing for live events. Up to eight times as many 13 to 34 year olds in the US opt to view Snapchat’s live stories rather than TV for similar events.
Because Snapchat is mobile-only, it boasts some benefits over Facebook and YouTube, both of which must cater to desktop users in addition to their mobile bases. Ads on Snapchat are always full-screen, always willingly viewed by the consumer, and always made for mobile. None of these items are true for Facebook or YouTube.
Snapchat’s vertical videos see a completion rate up to nine times that of horizontal mobile videos.
Consumers who saw an ad for a movie on Snapchat were three times as likely to have seen the movie as opposed to non-Shapchatters in same demographic.
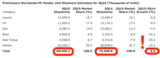
Snapchat is far from the most ubiquitous mobile messaging platform in the game (see chart,
below), but its 100 million daily active users are members of a demographic highly sought by advertisers.
Of the 13 to 35 year-olds in the US who use a smartphone, 60% use Snapchat, and almost 40% of Snapchat’s monthly users fall in the 18 to 24 year-old age range."
Read more: http://www.businessinsider.com/why-snapchat-is-the-best-mobile-video-platform-2015-6#ixzz3eUe7AoDN
Stephen
Stephen Abram
.
Blog
.
<span class='date ' tip=''><i class='icon-time'></i> Aug 05, 2015 04:38am</span>
|
|
5 Steps for Responding to a Social Media Crisis
http://www.adweek.com/socialtimes/5-steps-for-responding-to-a-social-media-crisis/622654
Some libraries have experienced these so here’s some advice.
"Social media is a volatile place. What moves people to action one day might bore them the next, and what’s seen as funny and tasteful to one person might be seen as objectionable to another. The reactions of your followers are difficult to predict, and your posting activity is controlled by humans, so no matter how hard you try, you’re going to end upmaking some mistakes.
There are different types of mistakes that can be made on social media. You might publicize something that was meant to be private. You might make a typo or post an incorrect link and fail to proofread before sending. You might post something with full understanding and the best intentions, but with a negative backlash from your audience.
The bottom line is that mistakes happen, and sometimes those mistakes will lead to a social media crisis, putting your brand in a vulnerable and difficult position. Some crises are so intense that it seems you may never recover, but countless major national brands have faced social chaos and emerged gracefully. If you find yourself in a particularly tough situation, follow these five steps to dig yourself out of it:
Step 1: Assess the Situation
Your first job is to assess the scope of the situation. Some crises can be gracefully swept under the rug, but others may require much more attention. Ask yourself the following questions:
How much time has passed since the offending material was published?
How many people have seen the offending material?
What percentage of readers are offended by the material?
How offended are the offended parties, on a scale of 1 to 10?
How out of line with the brand is the offending material?
Once you’ve thoroughly assessed the situation, you can start planning your response. For large-scale crises, you may need to recruit other team members or consult with your superiors before moving forward. For smaller ones, it’s usually a matter of responding as quickly as possible to avoid any further escalation.
Step 2: Delete the Offending Material
Once you’ve tracked down the offending material, it’s your responsibility to delete it. However, you should not delete any followers’ comments or responses to the material; only delete the material itself. I’ll discuss this in more detail in the next step, but for now, just focus on deleting the original post.
Also keep in mind that nothing on the Internet can ever be permanently deleted. If your post riled enough attention, it’s more than likely that it’s been screencapped and archived for posterity. Don’t be surprised if your post continues to pop up from other accounts; your goal here isn’t to remove the content entirely, but to show that you recognize its inappropriateness and are willing to take action against it. Sometimes, merely deleting the post and offering a public apology is more than enough to quell the anger or disappointment of your fans. In other cases, it’s at least a good start.
Step 3: Accept and Respond to Criticism
If your post reached enough people and provoked enough negative reaction, you’re going to be dealing with criticism from other followers. These could range from simple acknowledgments of your mistake to jokes to hateful or inflammatory messages. Be prepared for anything, but no matter what, you must follow the golden rule: Don’t delete a comment just because it’s embarrassing or less than ideal for your brand. If you’re caught deleting a comment unnecessarily, you’ll be subject to even more criticism.
Instead, make an effort to respond to every comment you can, directly and personally. Don’t revert to automated messages or repeated phrases over and over; genuinely read and respond to each comment uniquely. Doing so will show your followers you care and you’re listening actively to them.
Step 4: Work to Make It Right
Once you’ve addressed some of the first wave of comments, it’s your job to start making things right with your community. If you haven’t already offered a public admission of guilt and an apology, now is the time to do so.
Depending on the nature of your mistake, you’ll need to make a concentrated effort to reverse or mitigate the effects of your post. If you misled your customers about a product, you can offer a discount on future orders. If you made an unintentionally offensive comment, you can show your support for whatever group you offended. You can’t always make it right with your audience, but you can always make an effort—and it’s really the effort that counts.
Step 5: Perform a Root Cause Analysis
Once you’ve mitigated the effects of your mistake to the best of your ability, it’s your job to perform a root cause analysis and determine where things went wrong. Was it a lack of proofreading? A missing peer-review step? Poorly performed research? Once you’ve identified the actions and procedures that led to the mistake, you can correct your policies and prevent the mistake from happening in the future.
When it comes to social media crises, it’s less a matter of "if" and more a matter of "when." If you’re posting actively and building a community, eventually a post or campaign will slip by you and turn at least some of your followers against you. When it happens, keep your cool and treat it like you would any other critical situation: Follow the logical steps, temper your reactions and make proactive changes to avoid repeating the mistake in the future."
Stephen
Stephen Abram
.
Blog
.
<span class='date ' tip=''><i class='icon-time'></i> Aug 05, 2015 04:38am</span>
|
|
Beyond Tufte: Nine Great Books about Information Visualization
https://medium.com/@karlsluis/beyond-tufte-fd93cbcec6af
From designer Karl Sluis, a list of nine great books about information visualization not written by Edward Tufte.
Now You See It, by Steven Few
Semiology of Graphics, by Jacques Bertin
WSJ Guide to Information Graphics, by Dona M. Wong
Visualize This, by Nathan Yau
Information Visualization, by Colin Ware
Designing Interfaces, by Jenifer Tidwell
The Visual Miscellaneum, by David McCandless
World Geographic Atlas, by Herbert Bayer (OOP)
Metropolitan World Atlas, by Joost Grootens (OOP)
https://medium.com/@karlsluis/beyond-tufte-fd93cbcec6af
Stephen
Stephen Abram
.
Blog
.
<span class='date ' tip=''><i class='icon-time'></i> Aug 05, 2015 04:37am</span>
|
|
IFLA School Library Guidelines, 2nd edition (draft)
by IFLA School Libraries Standing Committee, Dianne Oberg and Barbara Schultz-Jones (Eds.)
http://www.ifla.org/publications/node/9512
"This is the new draft edition of the School Library Guidelines 2015 that has been submitted to the IFLA Professional Committee for approval.
These guidelines constitute the second edition of the IFLA ‘School Library Guidelines’. The first edition of the school library guidelines was developed in 2002 by the School Libraries Section, then called the School Libraries and Resource Centers Section. These guidelines have been developed to assist school library professionals and educational decision-makers in their efforts to ensure that all students and teachers have access to effective school library programs and services, delivered by qualified school library personnel.
The drafting of these revised guidelines involved discussion, debate and consultation with many people from many countries at workshops during IFLA conferences and mid-year meetings and through ongoing writing and review in person and online. The editors are indebted to the contributions of members of the Standing Committee of the IFLA Section of School Libraries and the executive board of the International Association of School Librarianship (IASL), as well as the other members of the international school library community who shared their expertise and their passion for the project.
Download
IFLA School Library Guidelines Draft [PDF]
To cite this document please use the following:
International Federation of Library Associations. 2015. IFLA School Library Guidelines Draft."
Stephen
Stephen Abram
.
Blog
.
<span class='date ' tip=''><i class='icon-time'></i> Aug 05, 2015 04:37am</span>
|