Blogs
|
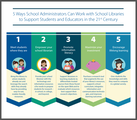
5 Ways School Administrators Can Help School Libraries
https://discovery.ebsco.com/pulse/article/5-ways-school-administrators-can-help-school-libraries#When:14:51:00Z
Stephen
Stephen Abram
.
Blog
.
<span class='date ' tip=''><i class='icon-time'></i> Aug 05, 2015 05:08am</span>
|
|
Perceptions of Canadian Provosts on the Institutional Role of Academic Libraries
by Mark Robertson
Mark Robertson is Associate University Librarian, Information Services in Scott Library at York University;
http://crl.acrl.org/content/76/4/490.full.pdf+html
"This study examines perceptions of provosts from Canadian researchintensive
universities regarding their institution’s academic libraries. Interviews
conducted with nine provosts explored how they perceive academic
libraries in terms of alignment with institutional mission, how they envision
the future of their libraries, and what they interpret as indicators of success.
The results suggest that provosts perceive libraries making significant
contributions to research and student learning, particularly through the
provision of access to information and the evolving role of library as place
respectively. Other areas of library expertise, such as scholarly communication,
appear somewhat less familiar to provosts, suggesting the need
for library leaders to promote new roles within the institutional context."
Stephen
Stephen Abram
.
Blog
.
<span class='date ' tip=''><i class='icon-time'></i> Aug 05, 2015 05:08am</span>
|
|
Convenience and quality: cloud-based personal research tools and the evolving scholarly record
http://www.libraryofthefuture.org/blog/2015/5/6/convenience-and-quality
Stephen
Stephen Abram
.
Blog
.
<span class='date ' tip=''><i class='icon-time'></i> Aug 05, 2015 05:08am</span>
|
|
10 steps to a value proposition for your library
http://proud2know.eu/10valueprop_blog21
"Libraries are embracing new opportunities to help better serve its students, teachers and researchers. The starting point is not always by thoroughly analyzing your current users and analyzing the surrounding contexts together with a multi-disciplinary team that really knows your users.
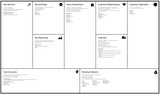
The Business Model Canvas can help you design a really customer-centred service portfolio. It can be used as a great strategic development and communication tool for staff, senior management and other stakeholders.
The Business Model Canvas was invented by Alexander Osterwalder & Yves Pigner. For more information on the whole canvas, see http://www.businessmodelgeneration.com/canvas/bmc
The Business Model Canvas is an excellent tool to help you describe, analyze and visualize your business model. In other words, such a model can help show you and your team and others how your library creates and delivers value to certain target groups, e.g. Bachelor students, Master students, PhD students, lecturers, Professors, administrators, in various contexts.
The Business Model Canvas, Strategyzer.com
For this month’s blog, using this model, I will focus on helping you get the key activities, pains and gains of your Customer Segment (1) clear for example, and relate your Value Proposition (2) to this knowledge. With value proposition, I mean the service offer that creates value for your customers or users.
Taking a practical example, I will take PhD students as one of the customer segments you could do more for. At this point, try not to think too much about specific service solutions for your PhD students; focus on their pains and gains first.
Your customer segment
1. Select a customer segment / target group that you need to focus on. Hone in on it with a multi-disciplinary team that knows your users well.
2. Then identify the jobs and tasks your PhD student aims to get done and list them in a customer/ user pie as shown in the diagramme.
3. Next, consider the pains associated with these tasks and list any obstacles and challenges.
4. As a following step, identify what they aim to gain through their jobs & tasks.
5. As a final analysis step, prioritize the jobs, pains and gains of your PhD student. This will help you come to a list that highlights the most important aspects you need to address in your value proposition, i.e. the most valuable service offer you could create for your students in this case.
6. Verify this knowledge with your PhD students before going any further.
Your value proposition
7. Analyze your value proposition by creating a value map.
8. Now turn back to your PhD’s pains list, and consider pain relievers. Then rank them in order of importance for your PhD student/supervisor.
9. Then call on their gains and list the gain creators to create valuable outcomes. Rank these gains also in order of importance for your PhD student/supervisor.
10. Fill this value map with a list of products and services that will answer the pains and gains of your users.
You’re on the road to developing a strong business model for your library. Other blocks such as what types of customer relationships you have, what channels you have to get your value proposition to your customers, etc. will come in a later blog post.
You will need time to further explore other aspects of the Business Model Canvas to create the more complete picture of the context that will influence and impact the success of your services. If you’d like someone from outside to help get your picture clear with your team also as a team-building exercise, drop me a mail: vproudman@proud2know.eu."
This work by Vanessa Proudman is licensed under a Creative Commons Attribution-NonCommercial 3.0 Unported
Stephen
Stephen Abram
.
Blog
.
<span class='date ' tip=''><i class='icon-time'></i> Aug 05, 2015 05:08am</span>
|
|
K-12 Report: Assessment Readiness, Money, & Privacy Top Priorities for School Technology Leaders
New Findings Revealed at CoSN’s Annual Conference in Atlanta
Washington, DC
Monday, March 16, 2015
http://cosn.org/about/news/k-12-report-assessment-readiness-money-privacy-top-priorities-school-technology-leaders
"Washington, DC (March 16, 2015) - According to CoSN’s (the Consortium for School Networking’s) 3rd annual K-12 IT Leadership Survey, school system technology leaders expressed greatest concern for assessment readiness, funding, and the privacy and security of student data.
The new findings, released today at the association’s 2015 Annual Conference in Atlanta, GA, provide K-12 leadership and stakeholders with a clearer sense of education technology challenges and priorities.
"Strong IT leadership is integral to the success of schools and districts," said Keith Krueger, CEO of CoSN. "The decisions IT leaders make affect schools and the students they serve far into the future. CoSN conducts this survey to gain a better understanding of the state of the chief technology officer (CTO) and gain deeper insight into who they are. The trends, challenges, and priorities that emerge from the survey results inform CoSN’s activities and help us to better address the changing needs of our membership."
Key findings of the report include:
For the second straight year, assessment readiness is the number one priority for IT leaders, yet less than 30 percent report they are fully prepared for online assessments.
Despite 30 percent reporting budget increases, 54 percent still indicate that they do not have enough money to "meet overall expectations of the school board / district leaders."
K-12 IT leaders are increasingly worried about the privacy and security of student data; fifty-seven percent said the issue is more important than it was last year. In 2014, CoSN launched a Protecting Privacy in Connected Learning initiative to help district technology leaders overcome this growing challenge.
Respondents expect their instructional materials to be at least 50 percent digital within the next three years.
K-12 IT leaders are not as well compensated as their counterparts in the private sector. Private sector chief technology officers (CTOs) in the bottom 10 percent of the private earnings range still earn more than the average K-12 IT Leader.
Female K-12 IT leaders earn less than their male counterparts. Among leaders in the lowest salary range, 65 percent are women.
K-12 IT leadership lacks diversity - 88 percent of leaders are white. While that percentage somewhat aligns with the general population of whites in the United States (78 percent), it does not reflect the make-up of the K-12 student body, which is projected this year to have a majority non-white population.
Leaders have extensive education technology experience. A remarkable 89 percent have been in education technology for more than six years, 42 percent for more than 10 years, and 31 percent for more than 20.
Leaders are very busy. Seventy-four percent are in charge of both instructional and administrative technology.
Fifty-eight percent of CTOs / chief information officers / district technology directors report to their superintendents — a best practice identified by CoSN.
The K-12 IT Leadership Survey was conducted in partnership with MDR and sponsored by SchoolDude.
For more about the survey, including previous year results, please visit: cosn.org/itsurvey2015, #CoSN15.
About CoSN
CoSN is the premier professional association for school system technology leaders. The mission of CoSN is to empower educational leaders to leverage technology to realize engaging learning environments. Visit cosn.org or call 866-267-08747 to find out more about CoSN’s focus areas, annual conference and events, advocacy and policy, membership, and the CETL certification exam.
- See more at: http://cosn.org/about/news/k-12-report-assessment-readiness-money-privacy-top-priorities-school-technology-leaders#sthash.fBgfIk2X.dpuf"
Stephen
Stephen Abram
.
Blog
.
<span class='date ' tip=''><i class='icon-time'></i> Aug 05, 2015 05:07am</span>
|
|
Results of South Carolina School Library Impact Study Now Available
Via Gary Price at LJ InfoDocket
http://www.infodocket.com/2015/05/14/results-of-south-carolina-school-library-impact-study-now-available/
From the South Carolina Association of School Librarians Web Site:
The South Carolina School Library Impact Study has been completed. During the SCASL conference in March 2015 a concurrent session was held to inform members of the study results.
The findings are available in two reports.
Reports
Phase 1: How Libraries Transform Schools by Contributing to Student Success: Evidence Linking South Carolina School Libraries and PASS & HSAP Results (79 pages; PDF)
http://www.scasl.net/assets/phase%20i.pdf
Usable responses from 787 schools to the South Carolina School Library Survey provided data on:
Numbers of librarians and library assistants
Library expenditures, both total and per student
Hours per week librarians spend teaching information literacy (combining reported data on collaborative planning, collaborative teaching, and independent teaching)
Circulation of library resources, both total and per student
Size of library print and e-book collections
Numbers of computers available to students in libraries as well as elsewhere in schools
Average number of group visits to libraries per week
Phase 2: How Libraries Transform Schools by Contributing to Stdent Success: Evidence Linking South Carolina School Libraries and PASS & HSAP Results, Phase II (52 pages: PDF)
https://scasl.memberclicks.net/assets/phase%202.pdf
The second phase of the South Carolina study, which is the focus of this second report, is an analysis of data collected in surveys of South Carolina school administrators, teachers, and librarians and test results from the state’s Palmetto Assessment of State Standards (PASS) for elementary and middle school students. While high school educators are included in the overall survey analysis, their sample size was insufficient to examine the relationships between their survey responses and test results from the state’s High School Assessment Program (HSAP) for high school students. Where possible, the accuracy of responding educators’ assessments of library teaching of standards was checked against actual state test results by standard.
Notably, this is the first state in which such a study has been conducted where this type of validity check has been possible, owing to the ready availability of standard-level test results.
SCASL also released this infographic.
Stephen
Stephen Abram
.
Blog
.
<span class='date ' tip=''><i class='icon-time'></i> Aug 05, 2015 05:07am</span>
|
|
This is a great resource for anyone posting to their public library’s social media accounts and websites. Sign up to get access to the esteemed Ben Bizzle’s project to collect and share.
Library Facebook Images Dropbox is moving.
Sign up at LibraryMarket.com
When Ben Bizzle created the "Library Facebook Images Dropbox" to share highly engaging social media images with the library community, he never imagined it would grow to a collection of over 1,000 images, with more than 800 librarian members. Shared Dropbox folders were never designed to be a platform for that level of collaboration. Therefore, the collection has been moved to a far more suitable web based platform, hosted and supported by Library Market. Sign up today and make sure to bookmark the page for quick and easy access.
The old Dropbox folder will no longer be available beginning June 1, 2015.
Stephen Abram
.
Blog
.
<span class='date ' tip=''><i class='icon-time'></i> Aug 05, 2015 05:07am</span>
|
|
How Social Media is Affecting Our Mental Health
https://guncarryinglibrarian.wordpress.com/2015/05/06/social-media-and-your-mental-health/
Stephen
Stephen Abram
.
Blog
.
<span class='date ' tip=''><i class='icon-time'></i> Aug 05, 2015 05:07am</span>
|
|
9 Ways the Most Successful People See Life Differently
Because success can often be achieved simply by changing your perspective.
http://www.inc.com/jeff-haden/9-ways-the-most-successful-people-see-life-differently.html
"Today, start changing your perspective on:
1. Failures
For most of us, failure isn’t the end of the world. Failure is just the end of an idea or a possibility or a dream. When we fail, we can move on to something else, with luck a little wiser and a lot more likely to succeed.
For some, though, failure means going without-or worse, possibly forcing their children to go without.
Failure sucks, but never being able to take a chance on your skills, your experience, and your vision is much, much worse.
Be thankful you have the opportunity to fail on terms you at least partly set. Many people do not.
2. Criticism
People criticize only when they care. While people still care about you or your business, you have the opportunity to do something better, to do something differently, to change their minds-or to just meet in the middle.
Apathy is much, much worse.
3. Unhappiness
When you’re sad, that means you care, and caring is the mother of changing things for the better.
Apathy is much, much worse.
Don’t dwell in unhappiness. Use it as fuel to make your life better.
4. Envy
Think of people you admire. Think of people who have earned your trust and esteem.
Be thankful those people are a part of your life. In fact, don’t just be privately thankful. Tell them how you feel.
That will make them grateful for people like you.
5. Decisions
You might have so many options and potential choices, both business and personal, that you feel stressed and even overwhelmed.
Flip it around: Imagine how it would feel to have few, if any, options. Imagine how it would feel to have few, if any, viable choices.
Be thankful you have options-the more, the better.
6. Struggle
Not unintentional struggle. Intentional struggle: like choosing to work incredibly hard or to push through a mental or physical barrier or to make sacrifices for the good of the people who rely on you.
When you struggle and fight and endure, you not only stretch the limits of what you believe you are capable of, but you also sometimes enter a state of grace that you find only when you strip away what is truly nonessential (which turns out to be most of what you worry about).
Struggling helps you learn who you really are-and who you really want to be.
7. Delays
Remaining patient is rarely fun, but having to wait can be a good thing.
For example, research shows that where vacations are concerned, the biggest boost in happiness comes from planning to get away. And this vacation anticipation boosts happiness for an average of eight weeks.
After the vacation, though, happiness levels quickly drop to baseline levels-usually within days. Soon the people who went on a vacation are no happier than the people who didn’t.
Be thankful you need to wait-especially for something you really want. The anticipation alone is worth it.
Besides, waiting for what you want-not what you need, but what you want-is a luxury only those who are already blessed can afford.
8. Regrets
Think about something you wish you had done better. Or handled differently. Or think about something you wish you had done, but for whatever reason, you didn’t.
Painful? Sure. And motivating.
Use that motivation today. Call a friend you’ve lost touch with. Mend fences with a family member. Be the bigger person and say you’re sorry. Do something you wish you had done.
You’ll be thankful you did.
9. Time
Because you have the time and resources to do something like reading this post, that means you have time: to improve yourself, to consider new ideas, to try to be a better person, to build better relationships with family and friends.
Time is your most important asset and what you should be most thankful for.
Time makes everything else possible. Stop doing things that don’t matter and spend your time making your dreams a reality."
Stephen
Stephen Abram
.
Blog
.
<span class='date ' tip=''><i class='icon-time'></i> Aug 05, 2015 05:07am</span>
|
|
To inform the other half of the audience at library story times:
90% of all new American mothers are millennials, and they buy things differently
http://mashable.com/2015/05/14/the-millenial-mom/
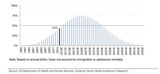
Percent of children age 0-17 whose parents are millennials
"We estimate that Millennials only recently reached critical mass, with a long runway to go," the report says.
Stephen
Stephen Abram
.
Blog
.
<span class='date ' tip=''><i class='icon-time'></i> Aug 05, 2015 05:07am</span>
|