Blogs
|
Lankes Faculty Minute
http://quartz.syr.edu/blog/?p=8159
Here is a great "Faculty Minute" that David Lankes did for the Syracuse iSchool on Expect More and libraries.
Stephen
Stephen Abram
.
Blog
.
<span class='date ' tip=''><i class='icon-time'></i> Aug 05, 2015 04:49am</span>
|
|
Toronto Star: Toronto’s City Librarian Discusses Ebook Pricing in Interview
From The Star:
Toronto Public Library is crying foul over "unreasonably high" ebook prices that it says limit its titles as demand soars for virtual reading.
In an interview with the Star on Tuesday, the city librarian [Vickery Bowles] called the prices and conditions "unsustainable," saying some publishers charge libraries $85 for an ebook while the average consumer gets the same title for only $15.99.
[Clip]
In 2009, the library spent under $200,000 on its electronic collection, 1.1 per cent of total spending. That figure is expected to be more than $3 million for this year, almost 20 per cent of the entire collections budget.
[Clip]
If Toronto Public Library is going to (need) 100 copies of an ebook, what would work for us is if we could buy 10 copies at a premium price of, say, $40 per copy, and we would have ongoing and perpetual access to those 10 copies," she said.
Read the Complete Article
Stephen
Stephen Abram
.
Blog
.
<span class='date ' tip=''><i class='icon-time'></i> Aug 05, 2015 04:49am</span>
|
|
2014 Journal Impact Factors
http://scholarlykitchen.sspnet.org/2015/06/18/2014-journal-impact-factors/
Yesterday "(June 18, 2015), the 2014 edition of the Journal Citation Report (JCR) was released, listing citation performance metrics for 11,149 journals. While the JCR calculates many different citation-based metrics, most editors and publishers will be chiefly interested in just one single metric-the Journal Impact Factor (JIF).
The JIF measures, for any given year, the citation performance of journal articles in their second and third year of publication. Despite regular attacks on the use of this metric for evaluation purposes (viz. DORA), JIFs are considered a crucial factor for where scientists choose to submit their manuscripts. A high initial JIF can result in a flood of new manuscripts (e.g. PLOS ONE); conversely, a steady JIF decline can signal that scientists should submit their best papers elsewhere. For new journals without a JIF, encouraging submissions can be a real challenge."
Stephen
Stephen Abram
.
Blog
.
<span class='date ' tip=''><i class='icon-time'></i> Aug 05, 2015 04:49am</span>
|
|
New Data: Americans Used 4.1 Trillion Megabytes (MB) of Data in 2014, Up 26% vs. 2013
Via Gary Price oat LJ InfoDocket
http://www.infodocket.com/2015/06/17/new-data-americans-used-4-1-trillion-megabytes-mb-of-data-in-2014-up-26-vs-2013/
"From CTIA-The Wireless Association (U.S. Wireless Industry Trade Group):
Today, CTIA-The Wireless Association released the results of its annual survey, which shows Americans used 4.1 trillion megabytes (MB) of data in 2014, a 26 percent increase over 2013.
Helping to drive the increase in data usage were smartphones and tablets, which now number more than 208 million and 35.4 million respectively, accounting for 68 percent of all mobile devices used on wireless networks.
According to the CTIA annual survey, every minute, Americans:
exchange 3.6 million text messages (SMS);
exchange almost 300,000 videos and photos (MMS); and
use 7.7 million MB of data.
One of the biggest trends in this year’s survey is the proliferation of multiple wireless devices in households. There are now more than 355 million total wireless subscribers, or 36 million more devices than Americans, a wireless penetration rate of 110 percent.
Top-Line results can be found in this 11 page PDF (Free). The full text report is fee-based. Purchasing info and methodology can be found here."
Annual Wireless Industry Survey
http://www.ctia.org/your-wireless-life/how-wireless-works/annual-wireless-industry-survey
Year-End U.S. Figures from CTIA’s Annual Survey Report
"Unless otherwise noted, facts are from CTIA-The Wireless Association,
CTIA’s Wireless Industry Summary Report, Year-End 2014 Results, 2015
Topic
Dec. ’14
Dec. ’13
Dec. ’12
Dec. ’08
Dec. ’03
Wireless Subscriber Connections
Equals # of active devices, including smartphones, feature phones, tablets, etc. Since users may have more than one wireless device, it is not equal to individual subscribers.
355.4M
335.6M
326.48M
270.3M
158.7M
Wireless Penetration
Equals # of active units divided by the total U.S. and territorial population (Puerto Rico, Guam and the USVI)
110%
104.3%
102.2%
87.2%
53.6%
Wireless-Only Households1
% of U.S. households
44.0%
39.4%
38.2%
20.2%
4.2%
Annual Wireless Data Usage (in MB)
4.06T
3.23T
1.468T
N/A
N/A
Monthly Wireless Data Usage (in MB)
338.4B
269.1B
122.3B
N/A
N/A
Annual Voice Minutes of Use
2.455T
2.618T
2.30T
2.20T
829.9B
Monthly Voice Minutes of Use
204.6B
218.2B
191.7B
183.8B
69.2B
Annual Text Messages
1.92T
1.91T
2.19T
1T
N/A
Monthly Text Messages (at year-end)
169.3B
153.3B
171.3B
110.4B
N/A
Annual Multimedia Messages
151.99B
96.1B
74.4B
14.9B
N/A
Monthly Multimedia Messages (at year-end)
15.4B
10.1B
7B
1.6B
N/A
Annual Wireless Revenue
$187.8B
$189.2B
$185.0B
$148.1B
$87.6B
Cell Sites
298,055
304,360
301,779
242,130
162,986
911 Calls2
460K
>400K
>400K
260K
139K
Capital Investment
$32.1B
$33.1B
$30.1B
$264.76M
$145.54M
K=Thousand
M=Million
B=Billion
T=Trillion
1Figure is from the Early Release of Estimates from the National Health Interview Survey, January - June 2014. National Center for Health Statistics, December 2014.
2CTIA Wireless 911 and Distress Calls.
CTIA Annual Wireless Industry Survey
CTIA’s annual wireless industry survey develops industry-wide information drawn from operational member and non-member wireless service providers. It has been conducted since January 1985, originally as a cellular-only survey instrument, and now including PCS, ESMR, AWS and 700 MHz license holders. No break-out of results specific to spectrum bands or licenses is performed. Previously a semi-annual survey, it is now released annually.
The information solicited from the service providers includes: direct employment, number of cell sites, total service revenues, capital investment and other metrics.
The CTIA survey also develops information on the number of reported wireless subscriber units or "connections" for the responding systems, and an estimated total wireless connections figure (taking into account non-responding systems).
To preview the report look at the Annual Year-End 2014 Top-Line Survey Results.
The report will be available for purchase shortly. If you would like to purchase the report, it will be at a member or non-member price. Annual subscriptions are also available.
Methodology
The Annual Wireless Industry Survey is completely voluntary and thus does not yield a 100 percent response rate from all service providers. However, the survey has an excellent response rate. For the December 31, 2014, installment of the survey, CTIA aggregated data from companies serving over 97 percent of all estimated wireless subscriber connections.
Because not all systems do respond, CTIA develops an estimate of total wireless connections. The estimate is developed by determining the identity and character of non-responding markets (e.g., RSA/MSA or equivalent-market designation, age of system, market population), and using surrogate penetration and growth rates applicable to similar, known systems to derive probable subscribership. These numbers are then summed with the reported subscriber connection numbers to reach the total estimated figures.
No carrier-specific or market-specific information is maintained as a result of the survey. All such information is aggregated by an independent accounting firm to a nationwide level. The underlying source material for the survey is then destroyed per confidentiality agreements."
Stephen
Stephen Abram
.
Blog
.
<span class='date ' tip=''><i class='icon-time'></i> Aug 05, 2015 04:48am</span>
|
|
THE NEW DEMOGRAPHICS OF SOCIAL MEDIA: Facebook is losing its grip on teens as visual social networks gain popularity
Read more: http://www.businessinsider.com/facebook-is-losing-its-grip-on-the-teen-demographic-as-visual-social-networks-gain-popularity-2015-6#ixzz3dM7K0hu5
TechMore: BI Intelligence Facebook Snapchat Instagram
"There are some fissures beginning to show in Facebook’s remarkably strong hold on nearly every demographic.
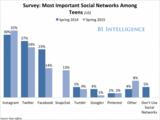
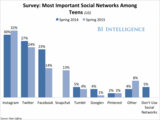
Teens, for instance, still use Facebook a great deal, but they no longer see it as the most prestigious or important social network: The rise in teens listing Instagram as their "most important" social network, and the decline of Facebook in this category, has been one of the most pronounced demographic trends in social media.
In late 2012, 42% of teens listed Facebook as the "most important," according to Piper Jaffray. By early 2015 only 14% did so. That’s a 28-point drop.
In a new report from BI Intelligence, we unpack data from over a dozen sources to understand how social media demographics and preferences are still shifting.
Access The Full Report By Signing Up For A Trial >>
Here are a few of the key takeaways from the BI Intelligence report:
Pinterest has tremendous reach among women. Among US female internet users, 42% reported being on Pinterest in Pew’s late-2014 survey, compared to only 13% of men.
Instagram has become the most important and most-used social network for US teens. 32% of US teenagers cited it as their most important social network in Piper Jaffray’s twice-annual teen survey, compared to only 14% saying that of Facebook.
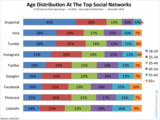
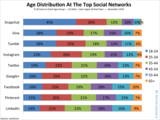
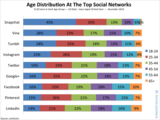
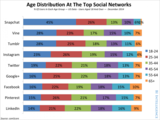
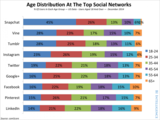
Snapchat, Vine, and Tumblr had by far the most youthful user bases of the social networks we looked at. 45% of Snapchat’s adult users are between 18 and 24, followed by Vine (28%) and Tumblr (28%), according to comScore.
LinkedIn enjoys high adoption among highly educated and high-income users. LinkedIn is used by 44% of Americans with income of $75,000 or more, according to Pew.
Messaging apps also have become more broadly popular, but still skew young: 7% of all people in the US aged 12 and older use WhatsApp, according to the Edison Research and Triton Digital survey.
The aging of Facebook, Twitter, LinkedIn, and even Pinterest is more apparent than ever. That’s especially true of Facebook: Less than two-fifths of Facebook’s adult user base in the US is aged 18 to 34, according to comScore."
Read more: http://www.businessinsider.com/facebook-is-losing-its-grip-on-the-teen-demographic-as-visual-social-networks-gain-popularity-2015-6#ixzz3dM7c9cbd
Stephen
Stephen Abram
.
Blog
.
<span class='date ' tip=''><i class='icon-time'></i> Aug 05, 2015 04:48am</span>
|
|
A Library Primer
Via LISNews
http://lisnews.org/a_library_primer
A book about libraries from 1903 that is in the Project Gutenberg collection.
There are 55 chapters in the book.
CHAPTER
PAGE
I,
The beginnings—Library law
9
II,
Preliminary work
10
III,
What does a public library do for a community?
12
IV,
General policy of the library
15
V,
Trustees
17
VI,
The librarian
20
VII,
The trained librarian
23
VIII,
Rooms, building, fixtures, furniture
25
IX,
Things needed in beginning work
30
X,
The Library Bureau
35
XI,
Selecting books
39
XII,
Reference books for a small library
46
XIII,
Reference work
53
XIV,
Reading room
57
XV,
List of periodicals
61
XVI,
Buying books
63
XVII,
Ink and handwriting
69
XVIII,
Care of books
73
XIX,
Accessioning
76
XX,
Classifying
78
XXI,
Decimal classification
81
XXII,
Expansive classification
84
XXIII,
Author numbers or book marks
91
XXIV,
Shelf list
92
XXV,
Cataloging
94
XXVI,
Preparing books for the shelf
99
XXVII,
Binding and mending
103
XXVIII,
Pamphlets
108
XXIX,
Public documents
110
XXX,
Checking the library
113
XXXI,
Lists, bulletins, and printed catalogs
114
XXXII,
Charging systems
116
XXXIII,
Meeting the public
122
XXXIV,
The public library for the public
123
XXXV,
Advice to a librarian
126
XXXVI,
The librarian as a host
128
XXXVII,
Making friends for the library
131
XXXVIII,
Public libraries and recreation
133
XXXIX,
Books as useful tools
134
XL,
Village library successfully managed
135
XLI,
Rules for the public
137
XLII,
Rules for trustees and employés
140
XLIII,
Reports
146
XLIV,
Library legislation
147
XLV,
A. L. A. and other library associations
152
XLVI,
Library schools and classes
154
XLVII,
Library department of N. E. A.
156
XLVIII,
Young people and the schools
157
XLIX,
How can the library assist the school?
160
L,
Children’s room
163
LI,
Schoolroom libraries
164
LII,
Children’s home libraries
166
LIII,
Literary clubs and libraries
168
LIV,
Museums, lectures, etc.
170
LV,
Rules for the care of photographs
171
The Project Gutenberg EBook of A Library Primer, by John Cotton Dana (copyright 1899)
http://www.gutenberg.org/files/15327/15327-h/15327-h.htm
Free, out of copyright and written by a library leader. Ready for some LIS schools. ;-)
Stephen
Stephen Abram
.
Blog
.
<span class='date ' tip=''><i class='icon-time'></i> Aug 05, 2015 04:48am</span>
|
|
Journal of Information Literacy
ISSN 1750-5968 Volume 9 Issue 1 June 2015 Article
Boss, K., Angell, K. and Tewell, E. 2015.
The Amazing Library Race: tracking student engagement and learning comprehension in library orientations. Journal of Information Literacy, 9(1), pp. 4-14. http://dx.doi.org/10.11645/9.1.1885
Abstract
Seeking to introduce first-year students to library resources and services in an engaging way, an orientation titled The Amazing Library Race (ALR) was developed and implemented at a university library. Informed by the pedagogy of problem-based learning, the ALR asks students to complete challenges regarding different departments and services. This study assesses this initiative’s success using observational and artifact-based data, addressing the challenging prospect of evaluating the impact of library orientation sessions. Two rubrics were developed to measure student involvement and student learning comprehension. More than 14 hours of in-class observations were used to track engagement, and 64 artifacts of student learning were collected and coded to evaluate learning comprehension. After coding, interrater reliability was established using the intraclass correlation coefficient to establish the validity of the ratings. This paper will outline these methodologies, present the results of the data analysis, and discuss the possibilities and difficulties of measuring student engagement in information literacy instruction centred upon active learning."
Copyright for the article content resides with the authors, and copyright for the publication layout resides with the Chartered Institute of Library and Information Professionals, Information Literacy Group. These Copyright holders have agreed that this article should be available on Open Access. "By ‘open access’ to this literature, we mean its free availability on the public internet, permitting any users to read, download, copy, distribute, print, search, or link to the full texts of these articles, crawl them for indexing, pass them as data to software, or use them for any other lawful purpose, without financial, legal, or technical barriers other than those inseparable from gaining access to the internet itself. The only constraint on reproduction and distribution, and the only role for copyright in this domain, should be to give authors control over the integrity of their work and the right to be properly acknowledged and cited." Chan, L. et al 2002. Budapest Open Access Initiative. New York: Open Society Institute. Available at: http://www.soros.org/openaccess/read.shtml [Retrieved 22 January 2007]. Boss, Angell & Tewell. 2015. Journal of Information Literacy, 9(1). http://dx.doi.org/10.11645/9.1.1885 4 The Amazing Library Race: tracking student engagement and learning comprehension in library orientations Katherine Boss, Librarian for Journalism, Media, Culture and Communication, New York University Libraries. E-mail: katherine.boss@nyu.edu Katelyn Angell, Reference and Instruction Librarian, Long Island University. Email: katelyn.angell@liu.edu Eamon Tewell, Reference and Instruction Librarian, Long Island University. Email: eamon.tewell@liu.edu
Read the Complete Article (12 pages; PDF)
Stephen
Stephen Abram
.
Blog
.
<span class='date ' tip=''><i class='icon-time'></i> Aug 05, 2015 04:48am</span>
|
|
Via David Lee King: http://www.davidleeking.com/2015/06/11/huge-list-of-social-media-policies/#.VX7SOPnF9EI
Huge List of Social Media Policies
"Social media policies and guidelines can be really hard to write. Thankfully, Social Media Governance can help! This site has links to hundreds of social media policies from corporate, government, and non-profit organizations and businesses."
Follow both links for insights.
Stephen
Stephen Abram
.
Blog
.
<span class='date ' tip=''><i class='icon-time'></i> Aug 05, 2015 04:47am</span>
|
|
New Research Report: "Mobile Video Usage, A Global Perspective"
Via Gary Price at LJ InfoDocket
http://www.infodocket.com/2015/06/14/new-research-report-mobile-video-usage-a-global-perspective/
From the IAB (Internet Advertising Bureau):
Contrary to popular opinion, mobile screens are regularly being tapped for streaming longer-form video, according to "Mobile Video Usage: A Global Perspective," a new comprehensive survey of consumers from 24 countries around the world who watch smartphone video. Thirty-six percent of total respondents said they watch videos that are 5-minutes or longer on their phones daily or more frequently. Smartphone video viewers in Turkey, Finland, China, Russia and Singapore are particularly frequent viewers of such videos. Even longer programming, such as movies and full-length television show episodes, are also viewed by audiences on mobile devices, with Chinese viewers being the most inclined to watch both films and TV shows on their mobile screens.
From the News Release and Summary
Across the 24 countries in the survey, there are several common ways that mobile video viewers discover digital video to view on their phones, including:
YouTube (62%)
Social media platforms (33%)
Search results (20%)
Advertising (14%)
When looking for mobile video to watch, advertising has even more influence in the U.S. (22%) and Canada (18%).
Apps are indisputably the main method for viewing mobile video in each of the markets studied. Nearly half of respondents overall (48%) said that they "only" or "mostly" leverage mobile apps to stream video on their phones, with the UK (63%), Brazil (60%), and Turkey (58%) leading the trend. By contrast, across the survey sample only 18% said they "only" or "mostly" use mobile websites to view video.
More than a quarter (28%) of viewers across the participating countries said that they often see ads on mobile video that they’ve already seen on TV. Numbers climb higher in France (38%), Turkey (36%), Finland (35%) and the U.S. (35%). But, marketers might be missing out with this approach - since 80+ percent or more of consumers in most markets expressed interest in any kind of tailored ad versus "I prefer no tailoring of ads at all." The findings point to the importance of ads being relevant to the content of the video being watched, but also show viewing history being a significant factor, especially in the U.S. and Canada.
Direct to Full Text Report (68 pages; PDF)"
Stephen
Stephen Abram
.
Blog
.
<span class='date ' tip=''><i class='icon-time'></i> Aug 05, 2015 04:47am</span>
|
|
Meerkat and Periscope: How Businesses Are Using Live Mobile Broadcasting
http://www.socialmediaexaminer.com/meerkat-and-periscope-with-brian-fanzo/
"The Social Media Marketing podcast is an on-demand talk radio show from Social Media Examiner. It’s designed to help busy marketers and business owners discover what works with social media marketing.
In this episode I interview Brian Fanzo, partner and chief digital strategist atBroadsuite, a company that helps businesses succeed with social and mobile marketing. Brian is one of the leading authorities on Meerkat and Periscope.
In this episode Brian Fanzo will explore the live mobile broadcasting apps Meerkat and Periscope and what they mean for your business.
You’ll discover the pros and cons of each platform, as well as how to get started."
Stephen
Stephen Abram
.
Blog
.
<span class='date ' tip=''><i class='icon-time'></i> Aug 05, 2015 04:47am</span>
|